

GMAT Question of the Day – Data Sufficiency – Statistics/Range
Last year the range of the annual salaries for the 800 employees at Company K was 45,000. If this year the 400 best paid employees at Company K each received a raise of x percent and the rest of the salaries remained constant what is the range of the annual salaries at Company K for this year?
1. x = 20
2. This year, the highest paid employee earns 2.4 times the lowest paid employee
[spoiler]C.[/spoiler]
GMAT Question of the Day Solution
This is a challenging GMAT statistics question. My guess is that we’ll see a lot of people picking either A or E. Whenever “range” is mentioned in a question always write down: Range = Max – Min Doing so will help frame the question. In this case you should notice that the only things that matter here are the Max and the Min. GMAT Data Sufficiency questions often seem to present a massive range of options. When I am teaching DS I have to constantly remind GMAT students that the scope of Data Sufficiency questions tends to be very limited. The better that you get at limiting the scope of the questions the better you’ll get at GMAT Data Sufficiency.
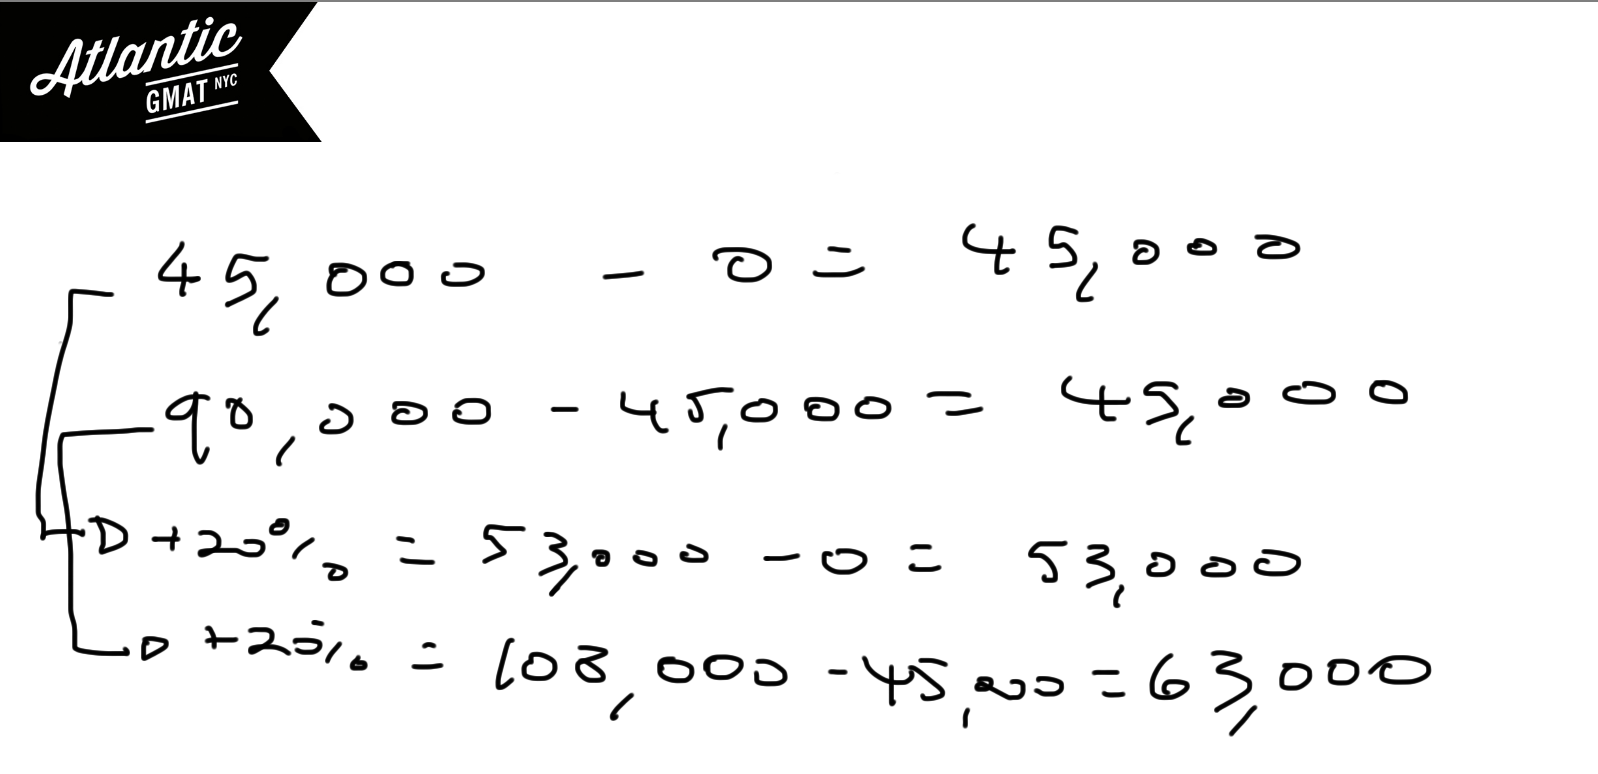
Let’s notice that we could pick a few different values for Max and Min and get the same range. For instance – $45,000 – 0 or 90,000 – 45,000. Both of these sets yield the same range. Let’s keep that in mind as we look at statement 1.
Statement (1) This is answer is very tempting. You might think that range just grows 20%. But let’s consider our examples above. Depending on the values we get different results for the new range. Bigger starting values will yield a larger range.
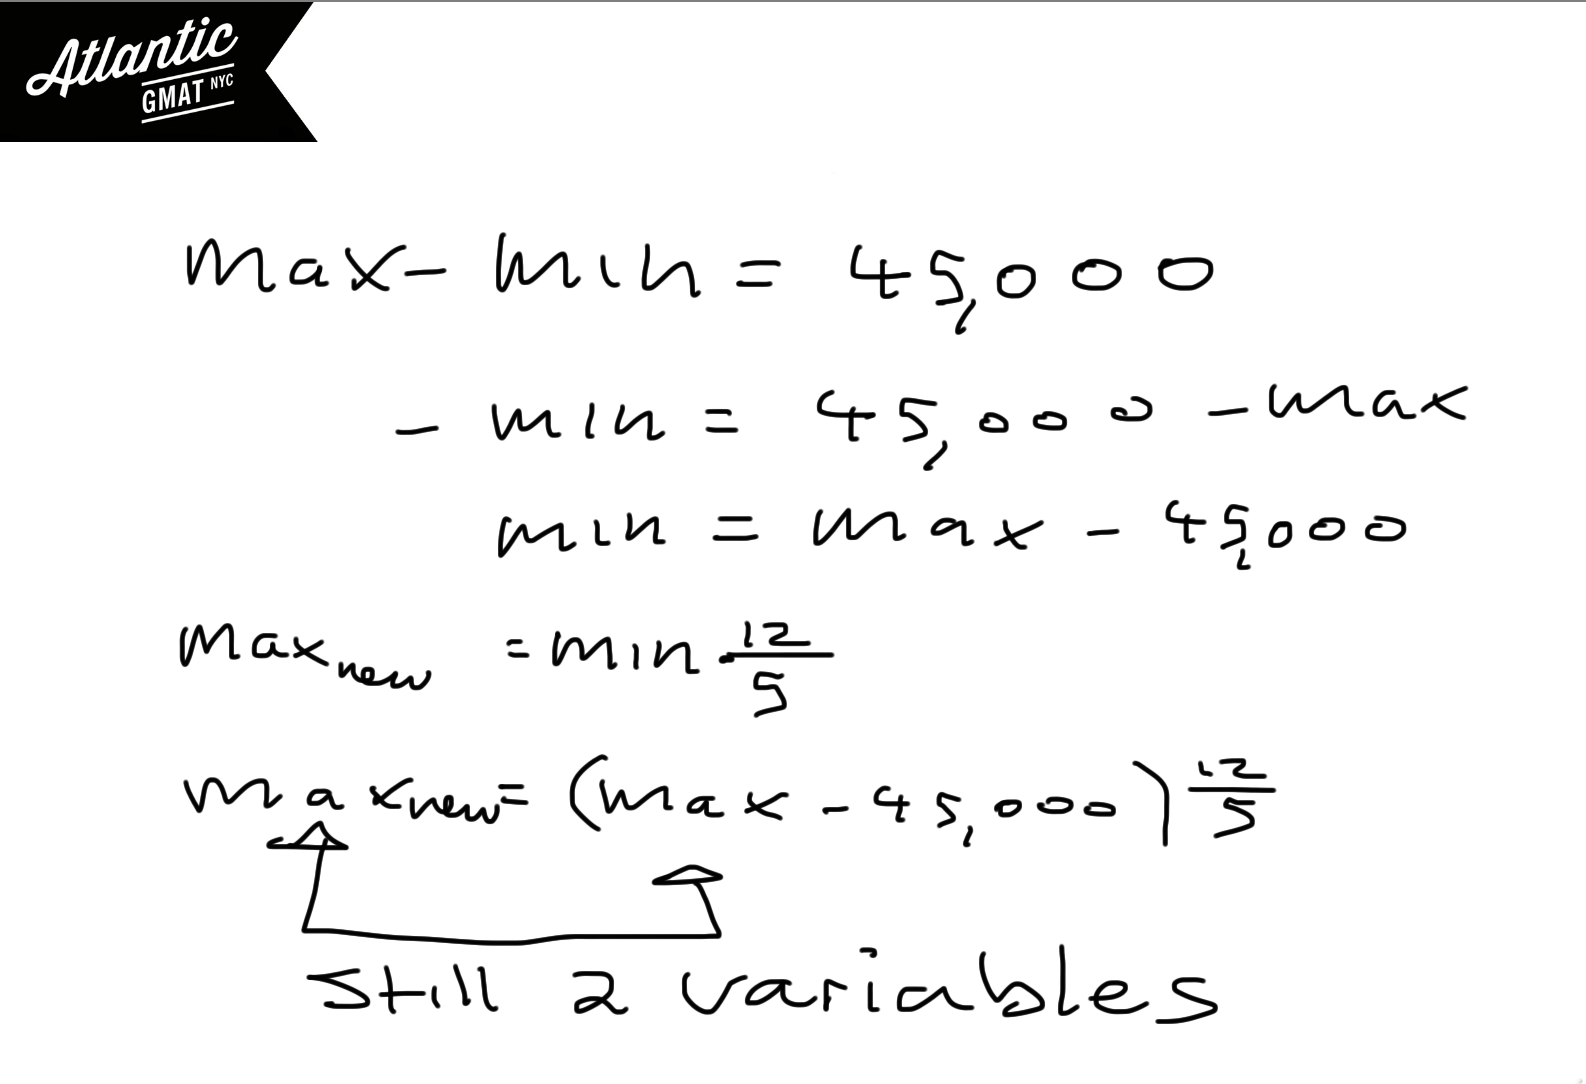
Statement (2) Without knowing the percent increase of the top salary or the value for the bottom salary this statement leaves with you very little information. You can do some substitution but you are still left with two variables. You might be thinking that there could some unique combination of Max (new) and Max but that is extremely unlikely considering that these values do not have to be integers.
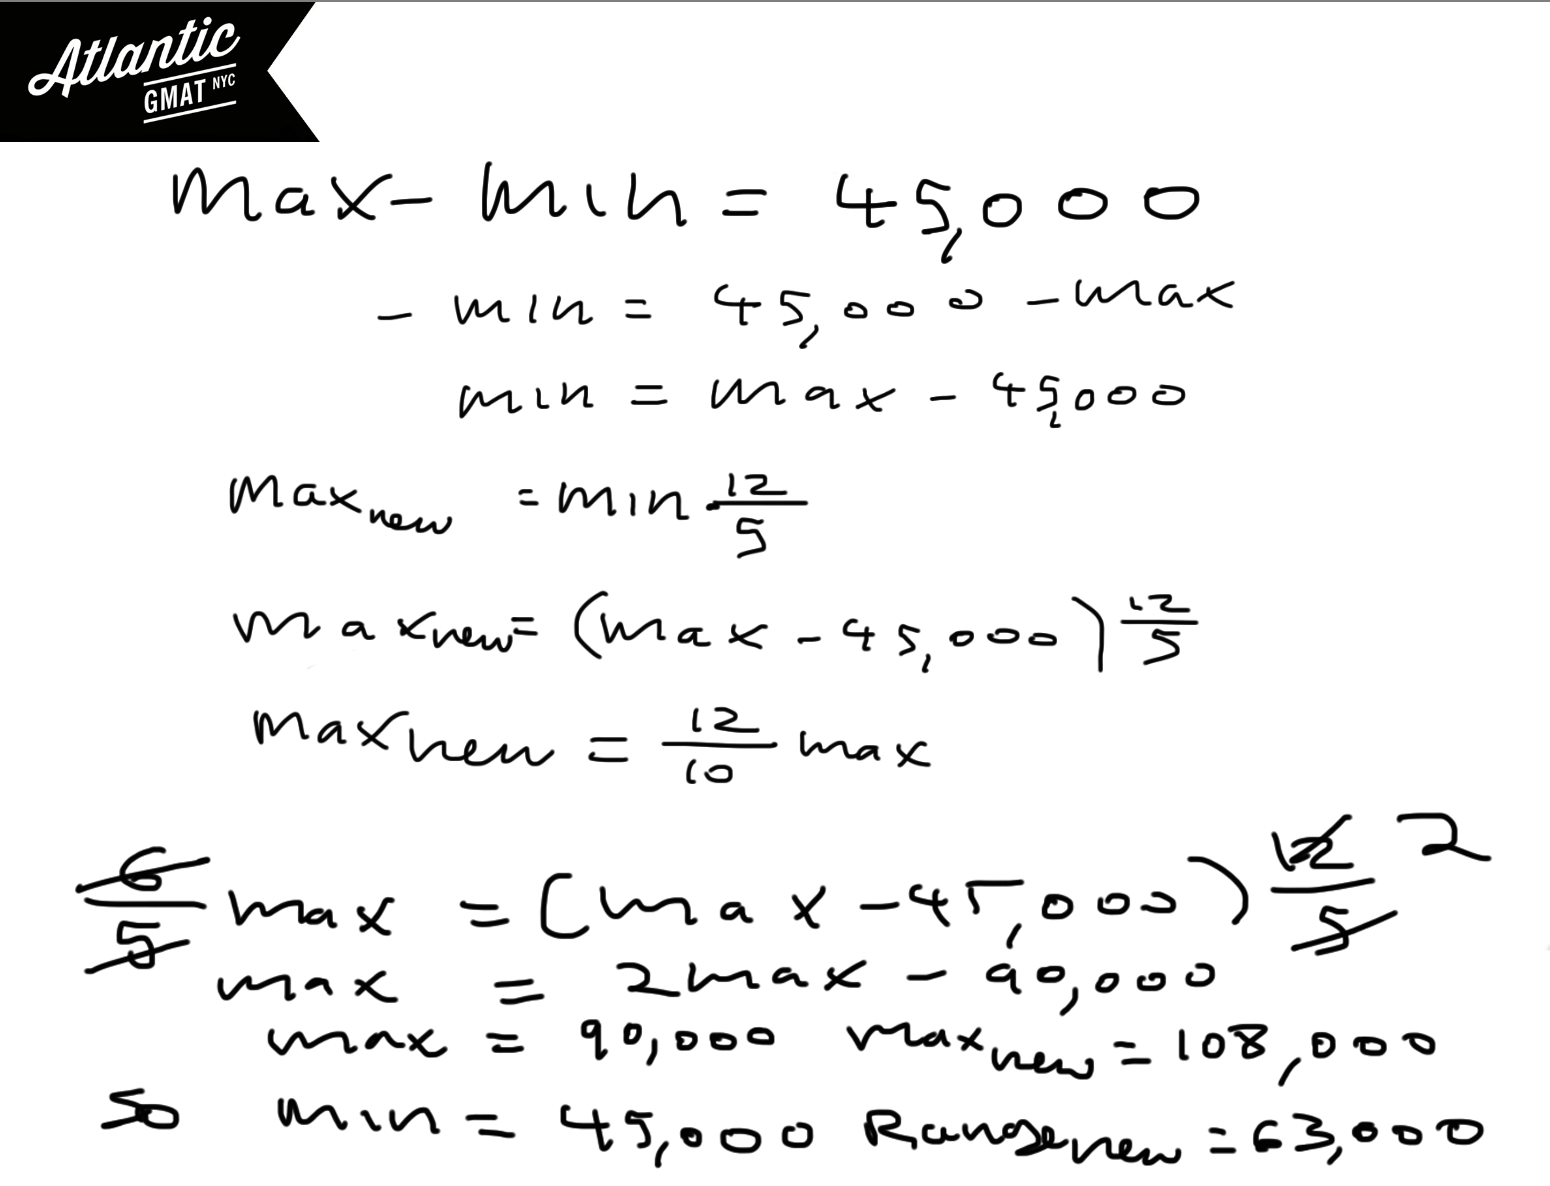
Statement (1) + Statement (2) Putting the statements together the proportion between Max (new) and Min is locked down and you can substitute Max (new) for Max since you know that Max (new) is 20% greater than Max. This leaves you with a range of 63,000. Once you see that you can solve this, you don’t have to finish the algebra but if it’s quick why not just make sure that the equation works out.
Additional GMAT Statistics Example Questions!
Here’s a GMAT statistics challenge (median/range) which will teach you how to work with a whole bunch of unknowns. Also a good one to work on maximizing a value.
Here’s a mini-statistics puzzle from the GMAT Official Guide. It has a very simple solution. Still, it’s surprising how often it comes up in tutoring sessions.
Here’s a challenging statistics, max/min question which we review in just about every GMAT preparation. it’s a great one to master not only to understand how to organize a whole bunch of potential variables but to understand how to put context on a max/min scenario.
Kind of a basic GMAT statistics question. Not the most challenging but it is still very important to be ready to interpret a chart/graph. What isn’t challenging in practice can quickly become a mess on test day.
Great one to wrap your head around statistics concepts and how they can be tested on the GMAT. It’s a problem solving question but having this square will also help you on DS statistics questions.
And here’s a very challenging GMAT statistics range question from GMAT question of the day that also incorporates a bunch of algebra and number properties. Stay organized!
Good luck and happy studies!